Visualization of Traceability Models
######Tags: publication VIATRA2
Authors: Ábel Hegedüs, Zoltán Ujhelyi, Ákos Horváth, István Ráth
In the GraBaTs 2010 article Visualization of Traceability Models with Domain-specific Layouting1 we introduced a method for creating a usable graphical representation for traceability models. In the paper we used a verification transformation as a case study, and detailed the possibilities of creating a visualization of the traceability models of the transformation. This webpage displays the results of the visualization.
The core visualization component can be downloaded from the Viatra2 update site, and additional features for visualization presets of the BPEL and Ecore examples are available as well.
###Case study: Traceability models of a transformation
In the paper we described a transformation of BPEL models to the SAL model checker tool for model verification. The traceability models of this transformation are used to back-annotate the results of the model checker to the original BPEL model to provide feedback for the BPEL developer. As demonstration of our visualization result we use two BPEL models as a source model: a very simple workflow model with a single node, and the credit process BPEL case study defined in the Sensoria project2. The traceability models were created in the Viatra23 model transformation framework, and the same framework has been extended to create a visual representation of this model.
###The traceability models of the simple BPEL workflow
Our simple workflow is the description of a format checker: first it receives an element in Rec1, decides whether if its correct, and if it is, it executes the fill output task, otherwise the transform task, then sends back the reply.

A simple layout algorithm.
To illustrate the need for the domain-specific layout algorithm, the first two images display the traceability models visualized using generic layout algorithms. The first uses a radial algorithm, that displays the nodes in concentric circles. This way the inner circle consists of the reference model. It is important to note, that the outer circle constains the elements of the source and target models mixed.
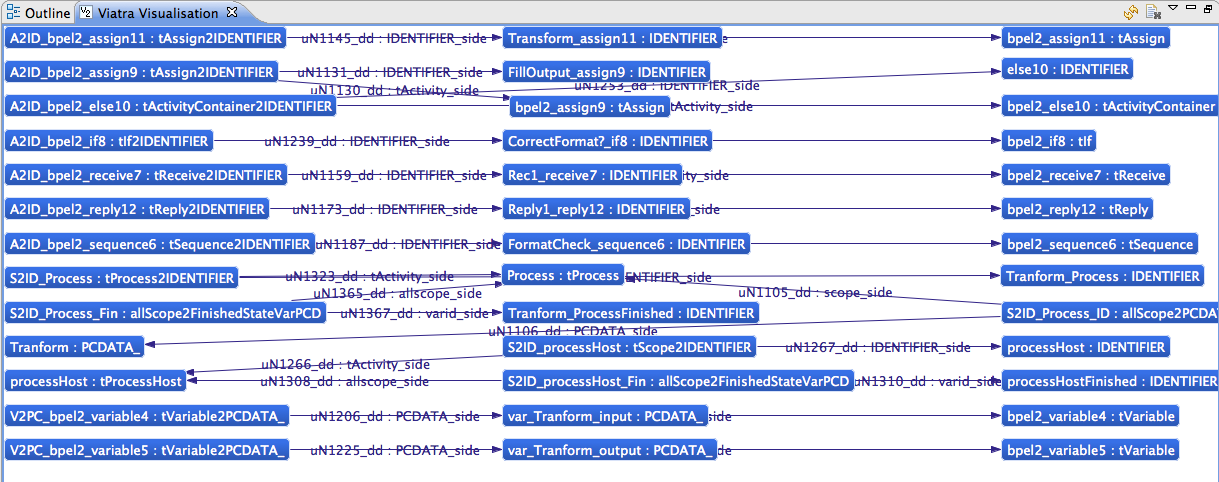
When using a generic, three-column grid as a layout algorithm, the result is not usable at all, as arcs are crossing each other, and the nodes as well, which harms the understandability of the graph. When using the same layout with a domain-specific ordering (as described in the paper), the result is much better: in the first part of the graph the result is as expected - three columns for the three parts of the model. But the end of the graph nodes get misplaced as the Process object is connected to more reference elements.
This issue can be fixed by replacing the column-selector part of the layout algorithm with a check of the element type: source elements get in the first column, target elements to the third column and reference elements to the middle one. This way the resulting graph looks better.

Radial layout - Simple BPEL model
Generic grid layout - Simple BPEL model

Ordered grid layout - Simple BPEL model

Domain-specific layout - Simple BPEL model
###The Traceability Models of the Credit Process BPEL workflow
The credit process workflow from the Sensoria project describes a credit request process in BPEL. We used this process as a running example for generating the traceability model, and then visualizing it.

Credit process - Overview

Credit process - Part 1/3
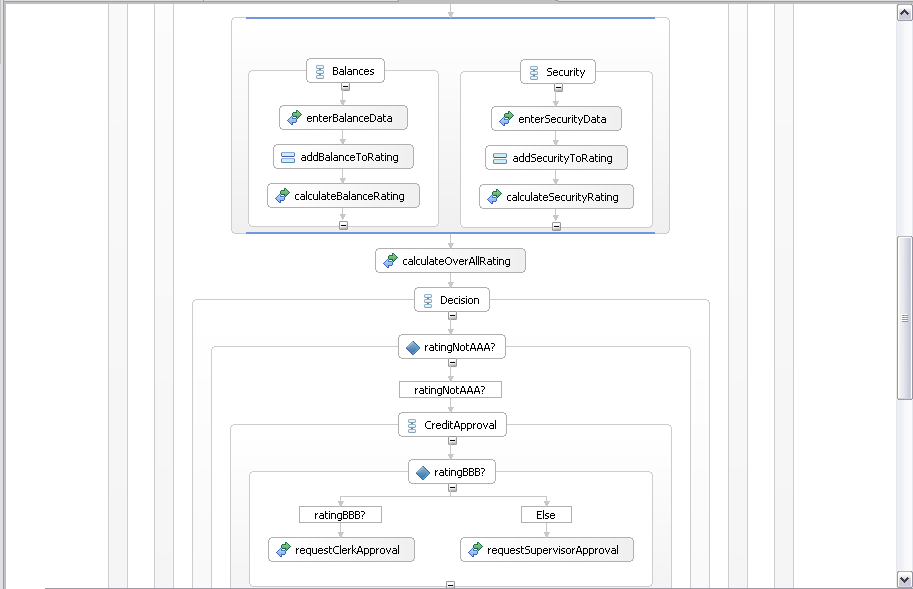
Credit process - Part 2/3

Credit process - Part 3/3
When using the radial layout on the larger BPEL model, opposed to the somewhat usable model of the simple workflow it becomes hardly usable at all, as the nodes are overlapping, and we get two concentric circle of nodes. On the other hand our domain-specific layout scales much better: although the resulting graph needs more space then available on a typical display, it only needs vertical scrolling, and remains clear-cut.
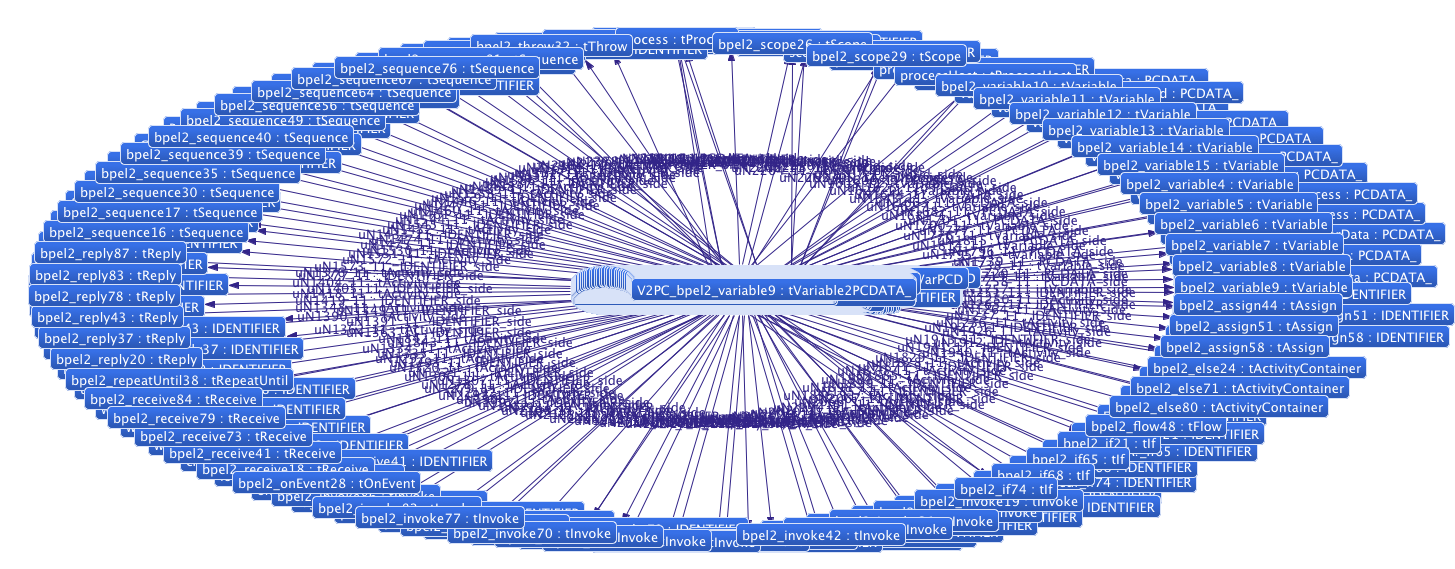
Radial layout - Credit Process

Domain-specific layout - Credit Process (part 1/2)

Domain-specific layout - Credit Process (part 2/2)
###Case Study: Ecore2Genmodel Transformation
We evaluated our layout algorithm using the Ecore to Genmodel case study of the Transformation Tool Contest 2010. The Ecore models are the metamodels of the EMF modeling framework, and Genmodels are used to generate classes from a referenced metamodel.
The case study asked for transformations, that could generate Genmodels from Ecore models. In this case static traceability was different, as the Genmodels contained direct references to the Ecore model, no dedicated traceability model was created.
A very similar solution can be used for the visualization of the traceability model in this case as in the the previous one, except only two columns are used for the source and target models. If the three-column layout is required, the connecting relations can be showed as nodes instead of arcs (as seen in the third image).
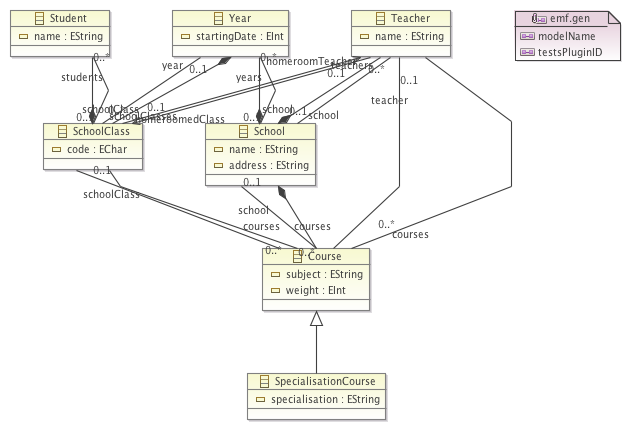
The Ecore diagram of the Source model
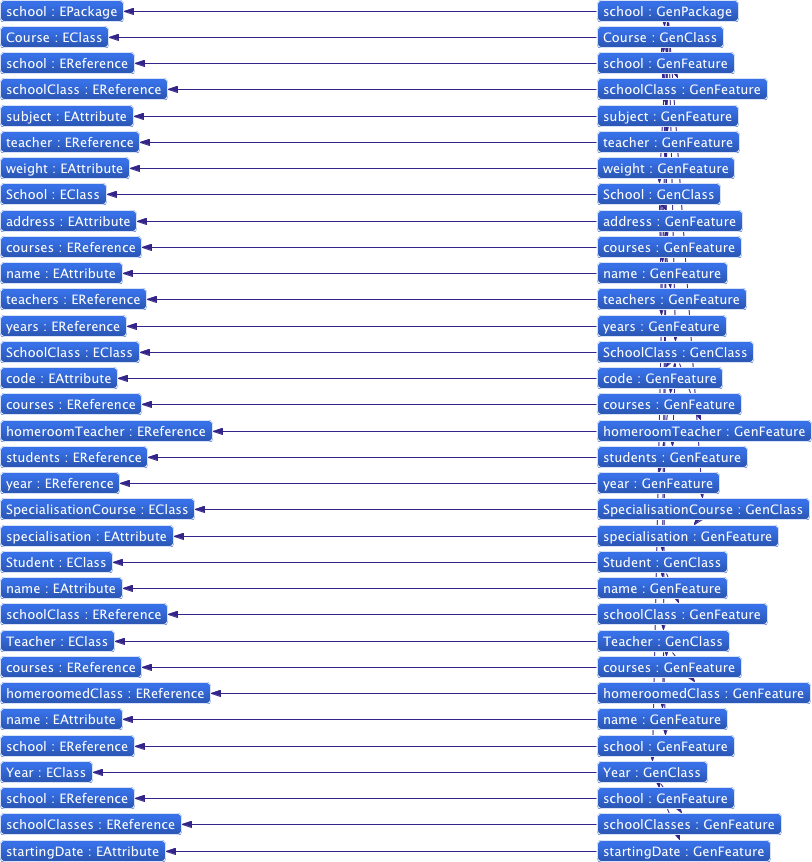
Visualization of the Ecore to Genmodel traceability model

Visualization of the Ecore to Genmodel traceability model with relations as nodes
###Video demostration
Overview video
This video shows the basic concepts of our solution. The layout algorithm has been updated a bit since the recording, but the basic conceptions still hold.
https://www.youtube.com/watch?feature=player_embedded&v=-14NafPduiY
Change Handling
This video illustrates how the proposed layout algorithm reacts to changes in the model space.
https://www.youtube.com/watch?feature=player_embedded&v=RR2SenFt2ag
Footnotes:
- This work was partially supported by the SecureChange European project (ICT-FET-231101) and the CERTIMOT project.
- Sensoria project: D8.3.a: Requirements modeling and analysis of selected scenarios Finance Case Study
- Viatra2 Model Transformation Framework